Angus Steer Value
Angus SteerSELECT provides an overall selection Index being Angus Steer Value (ASV). It balances 6 traits that have an impact on efficiency, production, and profitability in most beef supply chains, particularly those that include lot feeding.
The ASV assists in making “balanced” selection decisions to identify animals that have the genetic potential to suit specific beef supply chains. Higher ASVs identify steers have a balanced genetic profile with focus on beef quantity and quality.
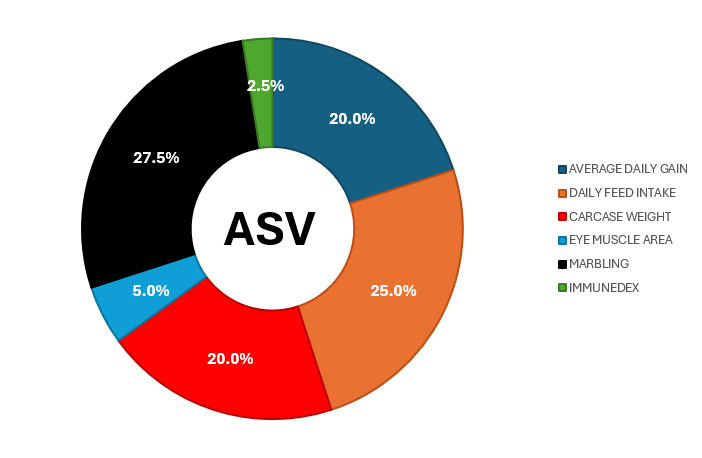
Figure 1 shows the traits that are considered in the ASV, and how much they contribute to the overall balance of the value. The larger the segment, the greater the impact on the selection index. In the ASV, there is a focus on increasing the beef quantity (carcase weight, EMA) and quality (Marbling), while improving efficiency (ADG and DFI) and maintaining resilience (ImmuneDEX).
Figure 2 shows the selection advantage if steers are selected using the ASV. The selection advantage is calculated by ranking a group of Angus steers on ASV and comparing the average genetic predictions of the steers in the top 30% with the average genetic predictions of all steers available for selection.
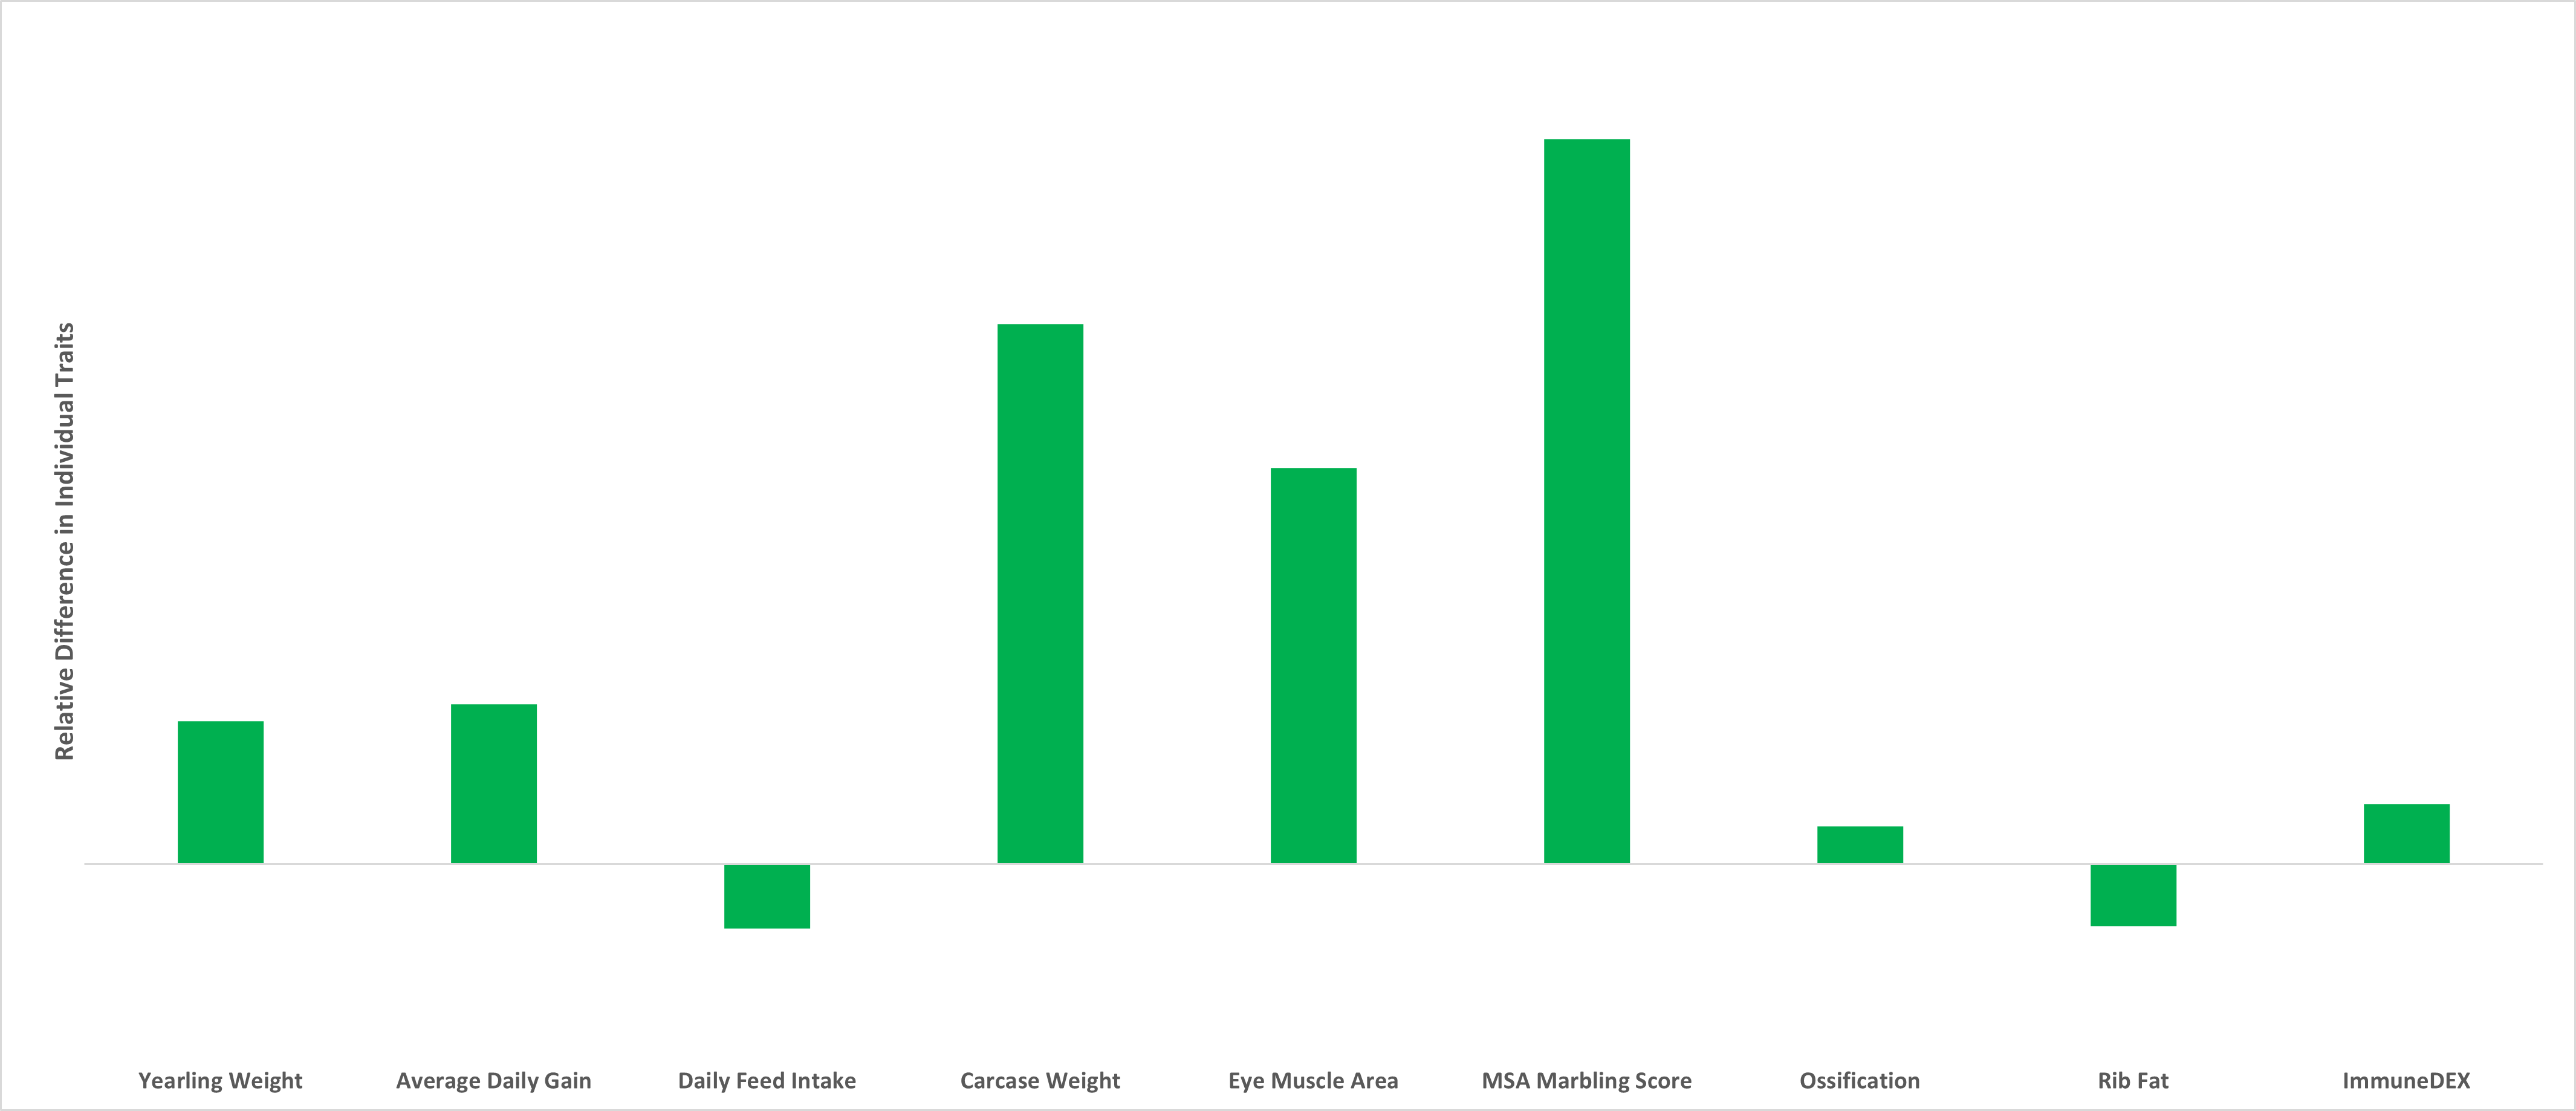
Angus SteerSELECT – Example of Performance by Genetic Prediction
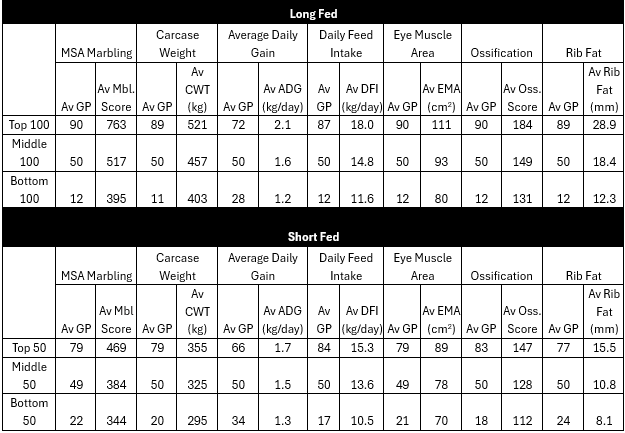
The following tables show the average performance (or phenotypes) in long-fed (>200 days on feed) and short-fed (100-120 days on feed) systems, when ranked on genetic prediction for specific traits. The long-fed and short-fed groups include 3,336 steers and 498 steer respectively. Both groups are included in the Angus SteerSELECT reference population.
As an example for interpretation, for the long-fed scenario, the top 100 steers based on the MSA Marbling genetic prediction average 763 for MSA Marbling score, followed by 517 for the middle 100 and 395 for the bottom 100 steers.
Note – an MSA Marbling score of 700 aligns with an AUS-MEAT Marbling score of approximately 5, MSA Marbling of 500 with an AUS-MEAT score of 3 and MSA Marbling of 300 with an AUS-MEAT score of 1.
Additionally, Table 3 exemplifies the percentage of animals that would meet marbling compliance specifications of greater than or equal to 500 MSA Marbling score (i.e. ~ 3 AUS-MEAT score) for long-fed animals and greater than or equal to 400 MSA Marbling score (i.e. ~ 2 AUS-MEAT score) for short-fed animals.

Further, below are the performance outcomes when the same groups of steers are ranked on the Angus Steer Value (ASV). For example, this shows when ranked on ASV, in the long-fed system, the top 100 steers compared to the bottom 100 steers had on average:
- Heavier carcases by 53kg,
- More Marbling by 258 MSA marbling score points (or approx. 2.5 more AUS-MEAT marbling scores)
- More muscle with eye muscle areas 13 cm2 larger.
- More efficiency with 0.6 kg/day less feed eaten
- More gain with 0.1 kg/day additional average daily gain