Using Percentiles to Benchmark an Animal’s Genetics within the Breed
Within the TransTasman Angus Cattle Evaluation (TACE), a percentile rank is calculated for each sub-population (i.e. animals registered with Angus Australia and AngusNZ). TACE percentile ranks demonstrate how an animal’s Estimated Breeding Value (EBV) compares to the current population of 2-year-old animals. This is useful because the genetic merit of most breeds has changed over time, meaning the current population is often quite different from the historical genetic base. Percentile ranks therefore help breeders understand how an animal’s genetics compare within today’s population, rather than against older benchmarks.
Percentiles cannot be compared across different benchmarked populations — such as between breeds, or between the same breed in different countries (e.g. Australian Angus vs. New Zealand or American Angus). While TACE EBVs for Angus cattle in both Australia and New Zealand are directly comparable (as they are calculated in the same genetic evaluation), the percentile ranks are not. This is because the percentile tables are calculated separately for cattle registered with Angus Australia and AngusNZ.
Using the percentile to compare each EBV against the breed average allows you to quickly identify exactly where an animal ranks within the population for each trait. Click Here to view the most current version of the TransTasman Angus Cattle Evaluation EBV Reference Table.
How to Use Percentiles
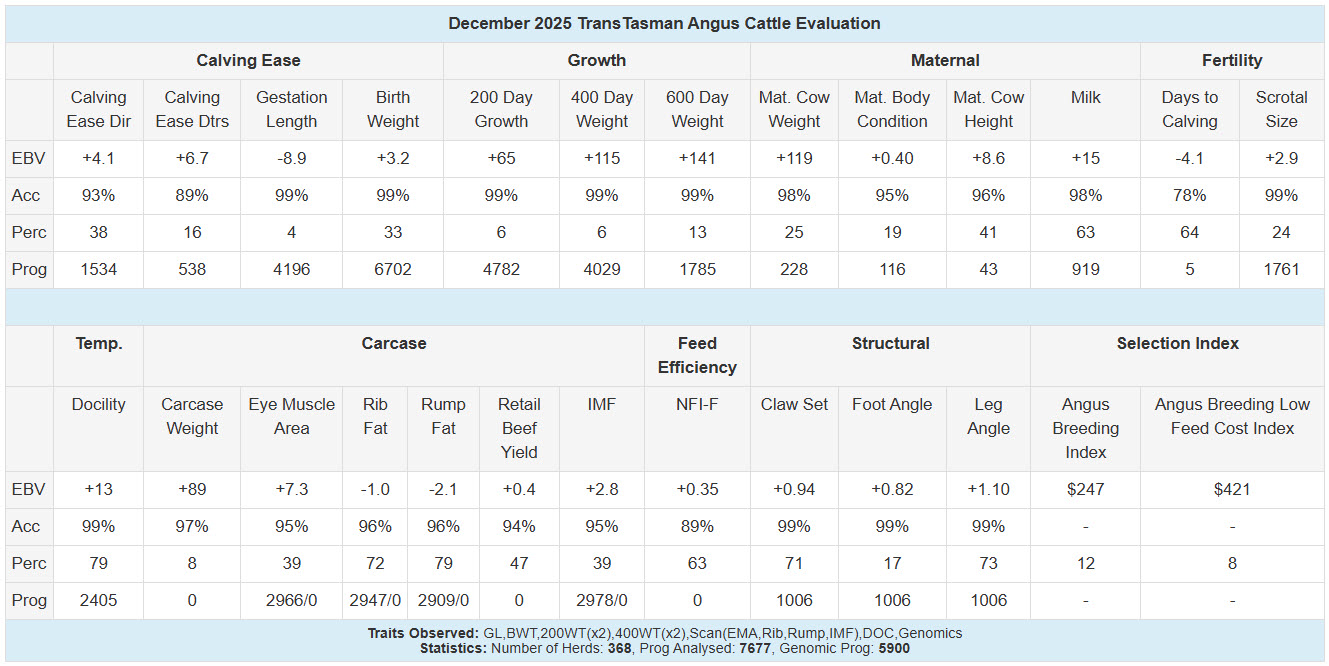
Using the demonstration animal, the EBV table below (figure 1.) indicates that this animal, with a 200 Day Weight EBV of +65 kg, ranks in the highest 6% of the population for growth at 200 days.
An alternative tool to compare an animal’s EBVs percentile to the current to the population is to use the EBV Percentile Graph (Figure 2.). This graph provides a visual representation of where an animal’s EBVs rank within the population for each trait. The EBV Percentile Graph (figure 2.) shown below also indicates that this animal, with a 200 Day Weight EBV of +65 kg, ranks in the Top 6% of the population for growth at 200 days. Importantly, the centre (50th percentile) of the graph indicates the breed average for the 2-year-old animals of the population.
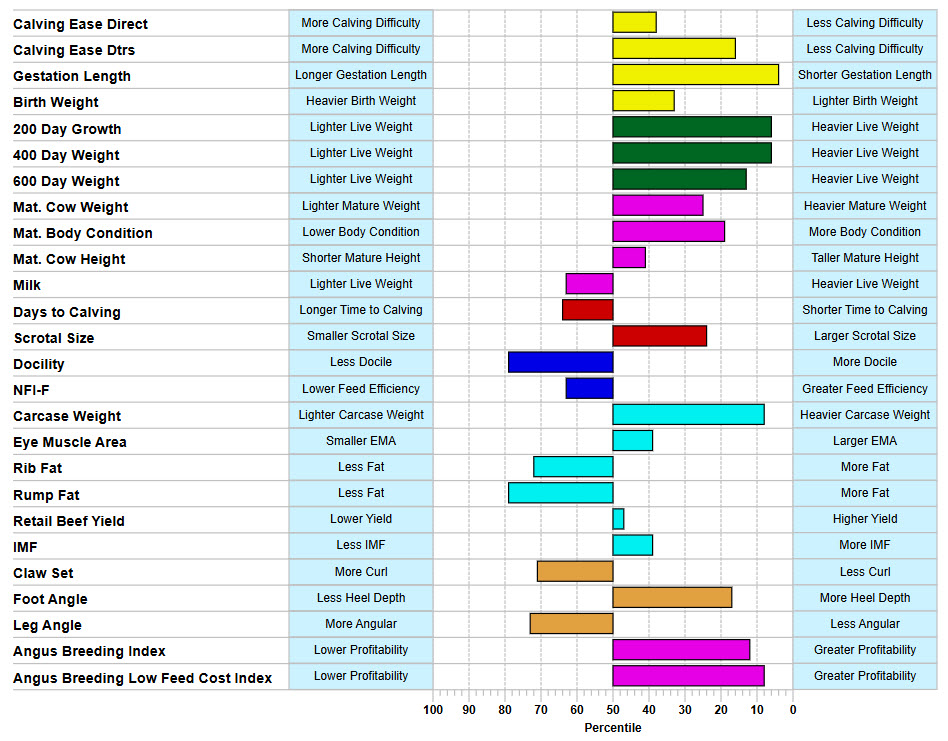
It is important to note that while for the majority of EBVs it is generally considered more desirable to rank higher in the percentile (i.e. on the right-hand side of the graph), this is not always the case. importantly, the optimum EBVs will depend on your individual breeding objective(s), and the direction in which you are trying to move the genetic level of your own herd. For example, a higher percentile for Mature Cow Weight indicates heavier cows at 5 years of age due to genetics. For those producers trying to moderate the mature cow weight of their herd, this may not be desirable.